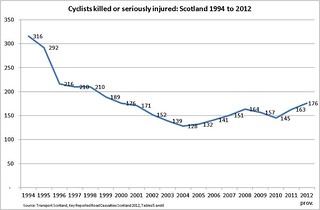
In that empty-headed time riding in to work I was thinking about the numbers killed or seriously injured.
They were falling steadily until 2004 and then started creeping back up again. They're the highest they've been for 10 years.
CityCyclingEdinburgh was launched on the 27th of October 2009 as "an experiment".
IT’S TRUE!
CCE is 17years old!
Well done to ALL posters
It soon became useful and entertaining. There are regular posters, people who add useful info occasionally and plenty more who drop by to watch. That's fine. If you want to add news/comments it's easy to register and become a member.
RULES No personal insults. No swearing.

In that empty-headed time riding in to work I was thinking about the numbers killed or seriously injured.
They were falling steadily until 2004 and then started creeping back up again. They're the highest they've been for 10 years.
That can't be true Insto, otherwise that's what Keith Brown would have said.
Are there any figures for injuries caused by political rhetoric colliding with reality?
But, according to Cabinet Secretary Brown, Scotland's roads are the safest they've ever been*. Shurely shome mishtake?
* - for motor vehicle occupants, perhaps?
"In that empty-headed time riding in to work".
I'm sure if a motorist came on here and said that, he would be shot down in flames. Shortly before being hung, drawn, quartered and then fed to the wolves.
You may have highlighted a reason for the statistics (which I can't see here at work but assume refer to cyclists, though the principle remains valid if not).
Surely cyclists, like all road users, should be concentrating on conducting their machines safely on the public highway (and, having seen the aftermath of a head-on involving two cyclists on the NEPN, the concentration levels off the public highway should not be much lower) :-) ?
So we can't think of anything else while cycling or driving?
"2012: cyclist casualties highest of century to date"
You may have highlighted a reason for the statistics
Blame the victim, that'll help.
Actually I can't be bothered...
@Blueth - Physics, proportionality, etc.
Walking > Cycling > Driving
Increasing speeds, increasing mass, increasing energy = increasing attention required.
The only possible reason to reverse this is when mixing energy streams.
Robert
@Blueth
Way to miss the point! I post about the highest level of cyclist deaths and injuries in 10 years and you lecture about a throw-away phrase. Spare me. I ride on paths almost the whole way from Fife to my office between 6.30 and 7.45am. If I pass or am passed by more than half a dozen pedestrians or cyclists it's been a busy morning. There's plenty of time for idle musing.
Anyway, since you raise it, the idea that people need to, should, or even can, give undivided, prolonged and focused attention to a single task is mistaken.
Wasn't it Einstein who said he got his best ideas while riding a bike? Of course with Einstein, even if he didn't say it eventually someone will attribute it to him.
I can't see the 'linked to' but am I to assume they take into account proportional take up of cycling as an activity? More people cycling=>more injuries/fatalities...
http://www.lbi.org/2012/09/albert-einstein/#4
He seems to have liked sailing too -
@TractorFactory
No, it's the raw numbers killed or seriously injured unadjusted for mileage. Expressing KSI as a ratio, as a risk relative to the amount of cycling only encourages the kind of complacency that the Government warns against in its press statements but practices in its 'do nothing' policy. Essentially, it leads to a position where more deaths and injuries are acceptable provided the amount of cycling increases. The deaths and injuries are the necessary and unavoidable consequence of more cycling. Nothing you could expect the Government to do about that.
In its report Transport Scotland writes:
There are now more cyclists on the roads which will impact on cycling casualty numbers with numbers increasing by around 30 per cent in the last ten years, as shown by the National Travel Survey and Traffic estimates published in Scottish Transport Statistics.
Which just reads to me as saying "more dead but more cyclists so that's OK then".
There's also absolutely no way that cycling has increased anywhere near the sort of percentages that those KSI stats suggest.
AFAIK, cycling still stands at 1% of all journeys and at most 2% of commutes.
This issue also relates to a point I made on the guardian blog - how you present the figures matters. Insto is better than 99.9% of us at making pages of number in excel make sense, but his graph was instantly understandable to all of us. So why were the government figures not more easily readable?
This London factsheet on the other hand, is far easier to grasp without being at all dumbed down. http://www.tfl.gov.uk/assets/downloads/corporate/casualties-in-greater-london-2012.pdf
On current trend, if you project that chart forward, we'll be back at 1995 levels in five years.
So why were the government figures not more easily readable?
At I guess I would assume they have to follow certain procedures when publishing anything that stipulates the formatting allowed pretty strictly and is standard across the board. And no doubt said procedure was written to fit an entirely different type of data report from a different branch of government but they are stuck with it because that is the 'procedure'.
Got to love the diseconomies of scale and top-heavy approach to governing taken.
Nah, they can publish data in any format they like so long as it's accurate. There will be a certain amount of inertia to the extent that it's easier to just update existing publications, adding a row or column or extending the line on a chart, than to rethink it every year. Anyway, the publication has been kicking around for years, is mainly used by nerds and statisticians who would be appalled and delighted in equal measure if any aspect of a publication were changed, even if the change was an improvement.
Fair enough :-) was a guess based on my experience of working in local government. Not sure if I feel any better though about it being down to nerd inertia!
While I don't want to disagree with the sentiment expressed above, isn't measuring absolute casualties and ignoring population about as squiffy as quoting nominal instead of real (inflation-adjusted) costs, for example?
The real point in my mind should be that we've done nothing for safety in the last X years, because injuries have risen in line with participation. Somehow it's been possible for the SNP to control the message such that a complete failure of a whole decade's road safety intervention to reduce casualties *at all* is not seen as a bad thing.
In that light, I can see that "casualties soar to highest level for ten years" is a great stick to beat the SNP with... :)
It depends on what you want to show. If you wanted to show that cycling was more risky, per unit of exposure, than driving you would want to show relative risks. The higher raw numbers would suggest that driving was more risky so you want to account for the extent to which levels of participation varied. In another thread I did that and showed that cycling had gone from (from memory) 13 to 25 times more dangerous than driving, mainly because the relative risk of driving had gone down whereas cycling had barely changed. Drivers are benefiting from road safety measures but cyclists aren't.
That used a distance-based denominator, which I don't really think is the best way to do it as I don't think it really captures each mode user's exposure to risk. Partly because the distance estimates for Scotland are, I found out today, really inaccurate. But mainly because, personally, I'd argue for a time-based measure which would offset the huge variation in speeds between different modes. KSI per hour travelling.
If you wanted to show the absolute risk - the odds of a cyclist being killed or seriously injured - the best way to do that would be to use the number of cyclists as the denominator. We know from the National Travel Survey and the Scottish Household Survey that the number of cyclists has hardly changed (which is another reason to think that the 30% increase in cycling kilometres is bogus) so with a constant denominator, the raw numbers express the same thing.
'The number of cyclists has hardly changed'
I can't believe that for one minute. If that's what the measurements show then they are either being incorrectly taken or they are measuring the wrong things. There's massively more cyclists on the roads now than 10 years ago. I understand that this has paralleld a fall in golf club membership.
A little over five years ago I started riding from Edinburgh to Fife every day on the NCN1. I would perhaps see two or three riders between the office and the outskirts of Edinburgh. I bet that's not the case now?
Still, it could be that existing cyclists are now commuting where they previously would have appeared on a survey but only rode their bikes once on a blue moon around the park, or something?
Growth in Edinburgh area - and some other areas - balanced by flat-lining elsewhere.
The Scottish Household Survey is one of the Government's official sources on mode share. It's a National Statistic, quality assured by the Statistics Authority. In 1999, it recorded 1.8% of adults usually travelling to work by bicycle. Edinburgh, with about 9% of the adult population, accounts for 20% of the cycling commuters.
In 2011, the survey recorded 2.0% of adults usually travelling to work by bicycle and Edinburgh accounted for 23% of those adults.
If Scotland has, roughly, 4m adults that means in Edinburgh in 1999 there were 14,400 commuting cyclists and in 2011, 18,400. Hardly any growth nationally but 27% growth in Edinburgh and, I suspect as the path network has improved the larger number in Edinburgh is also becoming more concentrated on particular routes. But in terms of cycling as a whole, I think that makes talk of massive growth a localised illusion.
But I also entirely accept that 'usual commuting' is only a partial measure of the totality of cycling but it's one that has been consistently recorded so any growth in cycling (provided it's not all in road racing, with no resulting impact on commuting) should be reflected in the other stats.
There are other measures in the SHS. The travel diary, which collects all journeys on the previous day, has shown almost no increase in cycling. For the time it has been in the survey (since 2009), cycling as an 'alternative mode' which complements the 'usual commuting' measure has increased by 0.7% and participation in leisure cycling (since 2007) has increased by 0.9%. Household access to bicycles also has not changed.
"Usual" mode of commuting would exclude everyone who's started but rides less frequently than three days a week.
i.e. DaveC of this forum, if I remember correctly, would not be counted as a cyclist as (at least until recently) he maybe only did 2-3 days a week by bike...
Asking whether people had commuted by bike in the last month might be a more illuminating measure?
That said, I daresay the travel diary thing would be expected to pick up on an incidental increase (although surely it would vary wildly with the weather). The 2011 household survey wasn't done in winter or anything, was it?
I have to say I tend to agree with Insto. There's a potential pitfall that we assume that what is happening in Edinburgh (similar but not as pronounced an effect as in London in recent years) is happening across Scotland.
I've been cycling in quite a lot of places in Scotland and I have to say I don't see much evidence of a cycling 'boom'. Edinburgh looks like an exceptional case.
Also, there were some stats recently (don't have link to hand) that showed London to be the only place in the UK to experience a decline in motor vehicle use. Everywhere else, motoring mileages continue to rise. That survey may not pick up smaller trends in places like Edinburgh, Bristol, etc. but it does show the scale of the challenge.
It wouldn't exclude them automatically unless they themselves thought that their bike commuting wasn't usual. I would say that someone who commutes one or two days a week by bike doesn't "usually" commute by bike although they do regularly commute by bike. The 'alternative' mode (which hasn't really been growing) would catch them though, although that's not been in the survey for as long. As would the travel diary.
Any commuting by bike in the last month might give you a bigger number but it's also a different number. It's measuring something else and it wouldn't necessarily be more illuminating. It wouldn't, for instance, show modal change or regularity, which would, for me, be the real indicators of growth in cycling.
The definitional issues don't matter all that much. In terms of measuring change over time what you need above all is consistency. If there's growth in cycling then it'll be reflected in a consistent measure even if the measure fails to completely capture the thing you're trying to measure. The exception is if the 'growth' is entirely lopsided. If everyone who started cycling only did it one day a week then none of them would ever 'usually' cycle. You wouldn't see the growth. But that would just be weird.
But I thought my post was just a long-winded, numerical way of saying what SRD had said succinctly - growth in Edinburgh (27%) but flat-line nationally. There is growth but its localised and maybe skewing perceptions of what's happening in general.
You must log in to post.

 Cycling in Edinburgh Flickr group
Video embedded using Easy Video Embed plugin
 posts
posts